Data modeling is like organizing your backpack so you can find your pencils, snacks, and books fast. It’s a big deal for keeping info neat and useful. A clear picture of data groups (like customers or orders) and their jobs in a business helps figure out what info an app needs. It sets up the details for each piece, like “every customer has a name and phone number,” and plans how to store and handle all that info in a computer or database (a fancy filing cabinet for data).
It also establishes common norms to all the users of the data such as acceptance that price ever refers to riyals in Saudi Arabia. Also, it is one of the main components of mapping as the data originates and flows through computer systems in order to have everything in order. To data detectives (scientists and analysts), it is immensely helpful in creating smarter apps that mine the data, such as what will be the hot games in the next year!
Table of Contents
What Is Data Modeling?
Data modeling refers to the art of developing a graphical representation of data, that is, data elements in relating to one another. These frameworks serve as templates to databases and information systems.
Key Goals of Data Modeling
-
Organize data logically
-
Reduce data redundancy
-
Improve data quality
-
Support business requirements
-
Enable efficient reporting and analytics
Types of Data Models
| Data Model Type | Description | Used By |
|---|---|---|
| Conceptual Model | High-level view of business data | Business stakeholders |
| Logical Model | Detailed structure without technical details | Analysts, architects |
| Physical Model | Database-specific implementation | Developers, DBAs |
Why Data Modeling Is Important
| Benefit | Explanation |
|---|---|
| Better Data Quality | Reduces inconsistencies and duplication |
| Faster Development | Clear structure saves development time |
| Scalability | Supports future growth |
| Improved Communication | Visual models are easy to understand |
| Regulatory Compliance | Helps maintain data governance |
Data Modeling Process (Step-by-Step)
| Step | Activity |
|---|---|
| Requirement Analysis | Understand business needs |
| Identify Entities | Define data objects |
| Define Relationships | Connect entities |
| Apply Constraints | Set rules and validations |
| Review & Optimize | Validate with stakeholders |
Data Modeling Tools
Its help professionals create, visualize and administer information models effectively. These tools aid diagrams, version control, collaboration as well as database synchronization.
Popular Data Modeling Tools in 2026
| Tool Name | Best For | Key Features | Platform |
|---|---|---|---|
| ERwin Data Modeler | Enterprise modeling | Advanced ER diagrams, governance | Windows |
| Lucidchart | Beginners & teams | Cloud-based, easy diagrams | Web |
| MySQL Workbench | MySQL users | Database design & SQL | Windows, macOS |
| Microsoft Visio | Business users | Visual diagrams, templates | Windows |
| DbSchema | Multi-DB environments | Schema sync, visual editor | Cross-platform |
| Oracle SQL Developer Data Modeler | Oracle databases | Logical & physical modeling | Cross-platform |
Top Data Modeling Tools in 2026: A Hands-On Comparison
Contemporary data representation tools are much more than just ER drawing. They envisage collaboration, access to the cloud, version control, and synchronization of databases in 2026. Some of the most popular tools that are used by professionals today are compared in a realistic manner below.
Comparison of Modern Data Modeling Tools
| Tool | Key Features | Collaboration | Pricing | Best For |
|---|---|---|---|---|
| ERwin Data Modeler | Advanced ER models, governance, impact analysis | Limited (enterprise) | Paid | Large enterprises |
| Lucidchart | Cloud-based diagrams, real-time collaboration | Excellent | Freemium | Teams & beginners |
| dbdiagram.io | Schema-as-code, fast ER diagrams | Basic | Freemium | Developers |
| MySQL Workbench | SQL + modeling | None | Free | MySQL users |
| DbSchema | Multi-database support, schema sync | Good | Paid | Cross-DB teams |
Key Takeaway
-
ERwin → best for governance-heavy enterprises
-
Lucidchart → best for collaboration and ease of use
-
dbdiagram.io → best for developers who prefer writing schemas
A Step-by-Step Data Modeling Tutorial
This section shows how data modeling works in real life, from idea to database.
Step 1: Understand Business Requirements
Example business need:
“We want to store customer orders for an online store.”
Step 2: Conceptual Data Model (High-Level)
| Entity | Description |
|---|---|
| Customer | Person who places orders |
| Order | Purchase made by customer |
| Product | Item being sold |
At this stage, no attributes or data types are defined.
Step 3: Logical Data Model (Detailed Structure)
| Entity | Attributes | Primary Key |
|---|---|---|
| Customer | customer_id, name, email | customer_id |
| Order | order_id, order_date, customer_id | order_id |
| Product | product_id, product_name, price | product_id |
Relationships:
-
One Customer → Many Orders
-
One Order → Many Products
Step 4: Physical Data Model (SQL Implementation)
Below is a simple SQL example generated from the logical model:
Modeling Flow Summary
| Stage | Focus |
|---|---|
| Conceptual | Business understanding |
| Logical | Structure & relationships |
| Physical | Database implementation |
Data Vault 2.0 vs. Dimensional Modeling
For data warehousing, advanced modeling techniques are required. The two most popular are Data Vault 2.0 and Dimensional Modeling.
Structural Comparison
| Aspect | Data Vault 2.0 | Dimensional Modeling |
|---|---|---|
| Core Objects | Hubs, Links, Satellites | Facts & Dimensions |
| Data History | Full historical tracking | Limited history |
| Schema Complexity | High | Simple |
| Load Speed | High (raw data) | Moderate |
| Query Speed | Slower | Fast |
Use Case Comparison
| Scenario | Best Choice |
|---|---|
| Highly regulated industries | Data Vault 2.0 |
| Agile data ingestion | Data Vault 2.0 |
| BI dashboards & reporting | Dimensional |
| Performance-focused analytics | Dimensional |
Pros & Cons
| Model | Pros | Cons |
|---|---|---|
| Data Vault 2.0 | Scalable, auditable, flexible | Complex, hard to query |
| Dimensional | Easy to understand, fast analytics | Less flexible for change |
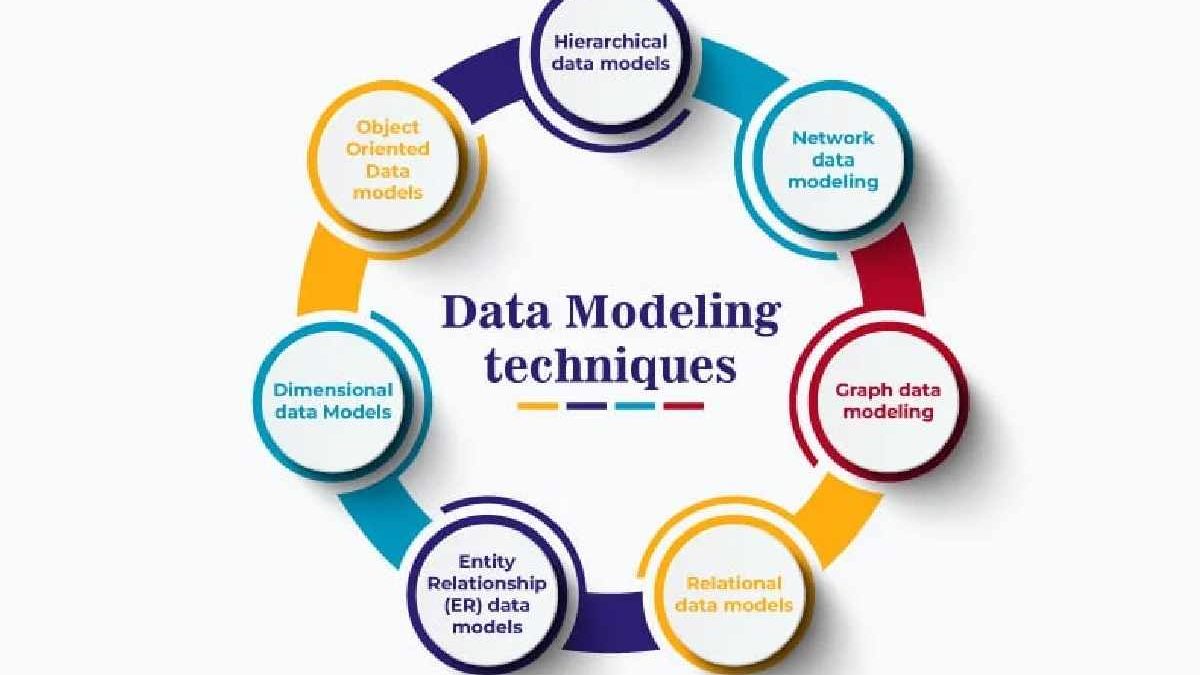
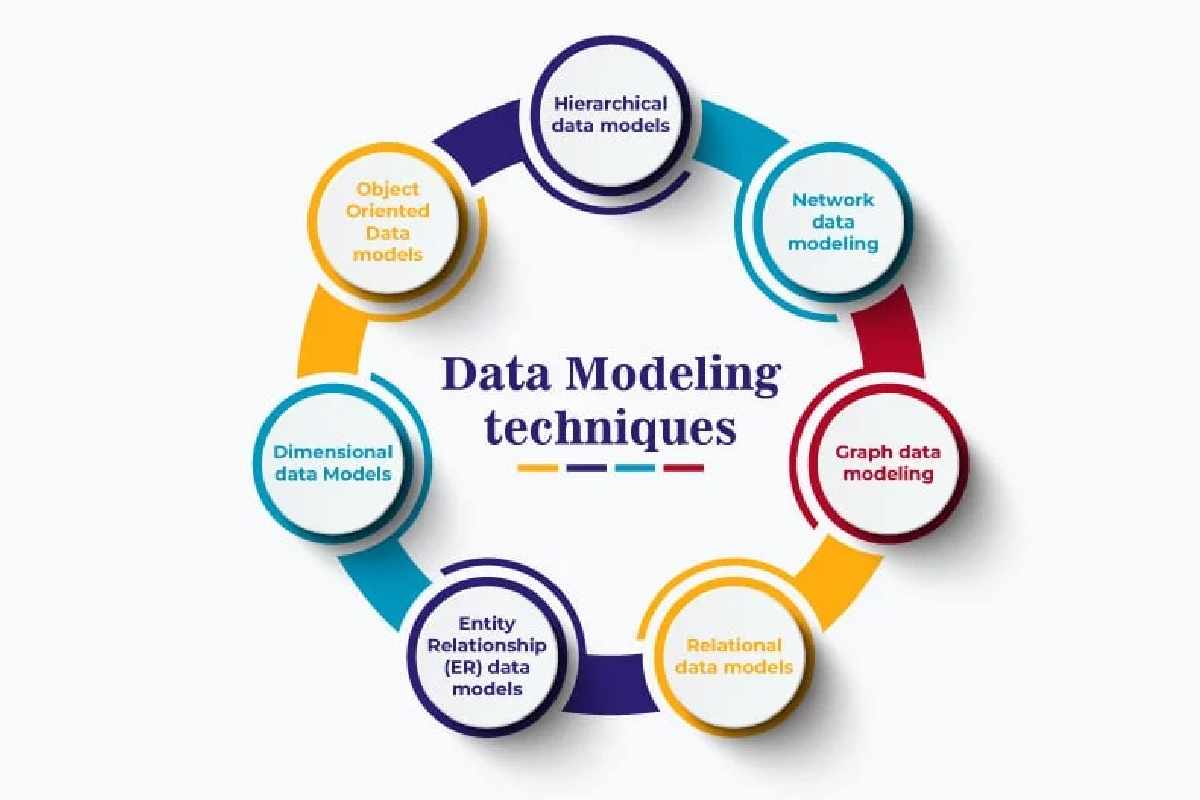
Data Modeling Examples: Fun Ways to Picture It
Think of a data model like a map for a video game world. Just like an architect draws a house plan to guide builders, a data model plans how info fits in an app. Here are some cool examples to make it crystal clear:
-
ER (Entity-Relationship) Model
This is like a friendship chart. It shows real things (entities) like “students” or “games” and how they’re buddies. For example, in a school app, a student is an entity, and their details (like name or grade) are attributes. The model draws lines to show connections, like “this student plays this game.” It also sets rules to keep things tidy, like “every student needs a unique ID.” -
Hierarchical Model
Picture a family tree with one main boss (the root) and branches for other stuff. It’s great for one-to-many links, like one mall with lots of stores. The mall is the “root,” and its “kids” are departments like clothes or toys. This model keeps things simple, like organizing your toy box by categories. -
Network Model
This is like a web of friends where everyone can have multiple besties. Data points (nodes) connect in a graph, so one “kid” node (like a toy) can link to many “parent” nodes (like stores and makers). It’s super flexible for tricky connections, like tracking who sells what. -
Relational Model
This one’s like a giant notebook with tables. Each table has rows and columns, holding details about stuff like customers or orders. It’s easy to spot links, like matching a customer to their purchase. Online shops use this to track what you buy and what’s in stock.
Types of Data Models: Three Levels of Planning
Data models come in three flavors, like levels in a game, each with a special job during app planning. They involve different people and have unique goals:
-
Conceptual Model
This is the big-picture sketch, like drawing a rough map of a new park. It shows the main things (like “visitors” or “rides”) and how they hang out together, without diving into techy details. It’s for the big dreamers planning the app. -
Logical Model
This gets more specific, like planning the paths and signs in that park. It maps out the details of each thing (like “visitors have names and tickets”) and their connections for a certain project. It’s a techy guide for building the app’s rules. -
Physical Model
This is the final blueprint, like deciding exactly where each tree and bench goes in the park. It shows how data lives in the computer, with exact details like “this column stores names as text.” It’s all about making the database real.
The logical model is like a rough draft that doesn’t build the database but helps plan it. The physical model takes that draft and makes it happen, turning ideas into a real, working system.
10 Common Data Modeling Mistakes and How to Avoid Them
Even experienced professionals make mistakes in data modeling. Below are real-world pitfalls and solutions.
| # | Mistake | Why It’s a Problem | How to Avoid |
|---|---|---|---|
| 1 | Poor naming conventions | Confusing models | Use consistent naming rules |
| 2 | No documentation | Knowledge loss | Maintain data dictionary |
| 3 | Over-engineering | Hard to maintain | Keep models simple |
| 4 | Under-normalization | Data duplication | Apply normalization rules |
| 5 | Ignoring business rules | Incorrect logic | Validate with stakeholders |
| 6 | No primary keys | Data integrity issues | Always define PKs |
| 7 | Weak relationships | Broken queries | Use proper foreign keys |
| 8 | Not planning for growth | Scalability issues | Design for future |
| 9 | Tool dependency | Vendor lock-in | Keep models tool-agnostic |
| 10 | Skipping reviews | Hidden errors | Conduct model reviews |
Expert Tip
“A good data model is not the most complex one — it’s the one everyone understands.”
Final Thoughts
Related Reading: Check out our guide on how to choose the right Assignment Management Software.